Information compiled by Bella Chamberland
Content Warning: This document will discuss extreme weather and its impacts, which will include mention of death and injury. It will also discuss how these deaths and injuries disproportionately impact marginalized communities. It does not have any graphic descriptions or images of these events.
Access summary:
- Illinois faces many extreme weather events like heat waves, floods, snowstorms, and tornadoes. These events are happening more often and getting stronger because of climate change.
- Heat is the deadliest weather risk in Illinois, causing more deaths than tornadoes, floods, or cold. Illinois is also one of the fastest-warming states in the country.
- Floods, heavy rain, and drought are major problems too. They damage homes, roads, and farms, costing billions of dollars and making food production harder.
- Certain groups of people are at higher risk, such as children, elderly people, unhoused people, disabled people, and neighborhoods that lack air conditioning or green spaces. Wealth inequality and racism make these risks worse in some communities.
- Resources exist to help people prepare and stay safe, like cooling and warming centers, and weather safety guides.
Introduction
While Illinois is not always considered a hotspot for extreme weather, it is actually a major site of floods, winter storms, tornadoes, lightning, and heat and cold waves. It sees hundreds of extreme weather events per year, usually resulting in injuries, school closures, billions of dollars of property damage, and sometimes death. This factsheet provides an overview of Illinois’ different extreme weather events and their impact. First, it outlines heat, precipitation, and tornado patterns, emphasizing the role of climate change and increasingly extreme weather. Second, it discusses how these events impact residents, infrastructure, and the economy with particular attention to disproportionate impacts. Finally, it concludes by offering links to resources and further information.
I: Extreme Weather Events and Trends in Illinois
In recent years, Illinois has experienced higher temperatures, unusual precipitation patterns, and more tornadoes in the region. The chart below talks about one region of Illinois, Chicago. Below, it describes that extreme heat, flooding, and drought are the most risky, while severe thunderstorms and severe winters still pose a moderate risk.
Figure 1: Climate Risk and Vulnerability Assessment for the Chicago Metropolitan Region 20191
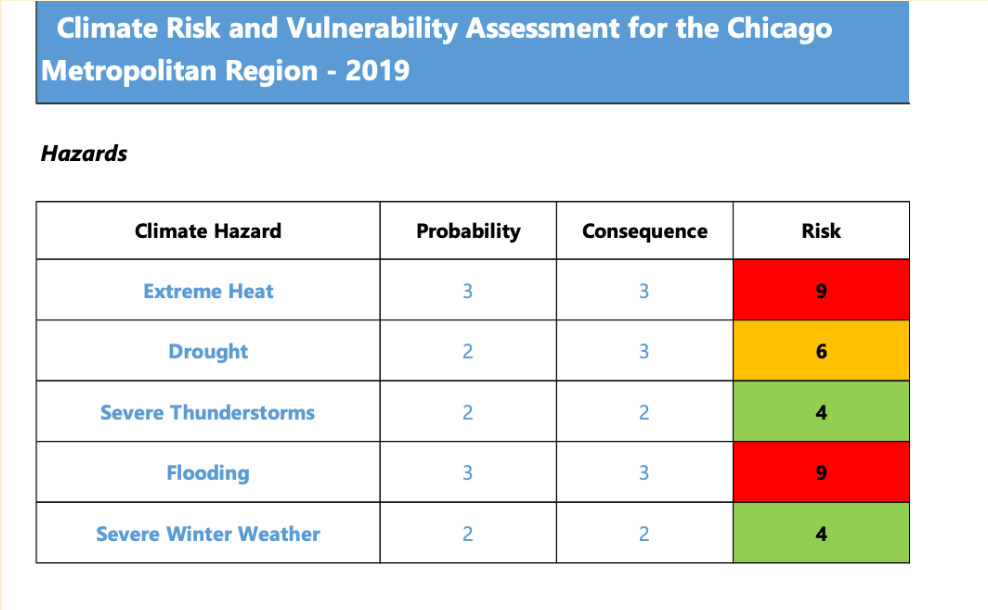
As we will see in the rest of the fact sheet, these extreme weather events are present throughout other regions of Illinois.
Heat
Heat, often described as “silent killer”, is a major contributor to extreme weather in Illinois. According to the chart below, it is the number one contributor to death out of all weather events since 1995.2
Figure 2: Weather Fatalities 20243

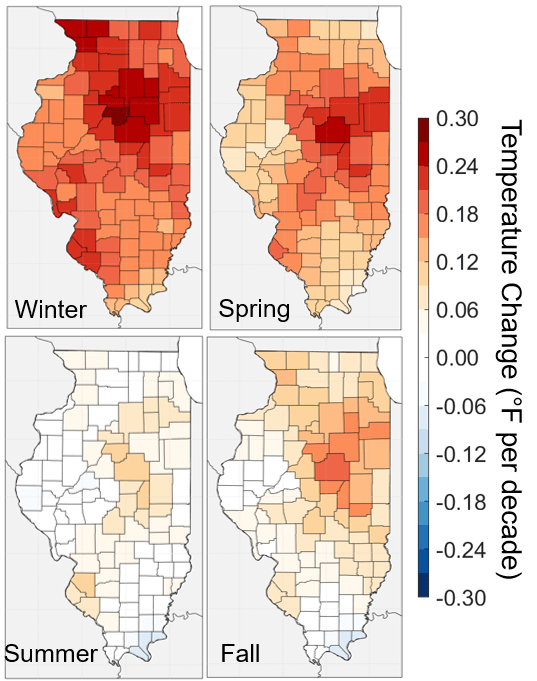
In Illinois, heat is not only a risk, but an increasing danger as global warming accelerates. As the map below describes, Illinois is among 13 states in the US with the fastest-rising temperatures.
Figure 3: Where Temperatures Are Rising Fastest4
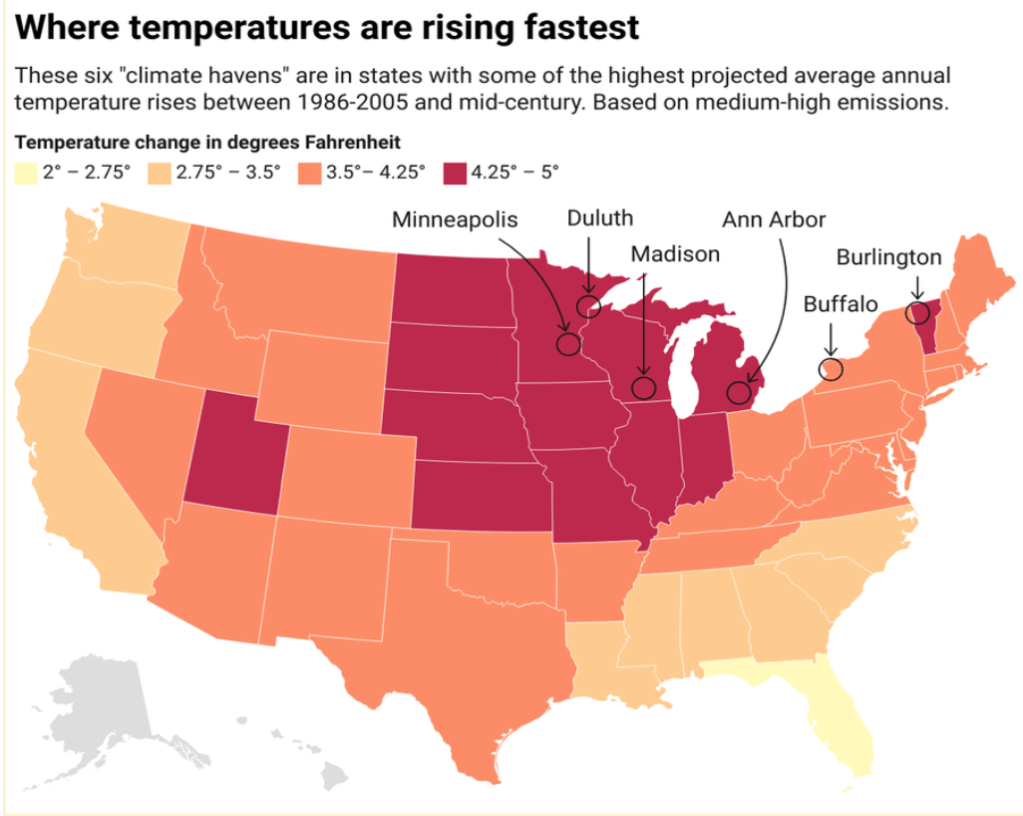
The term climate haven, as used in this chart, refers to a particular geographical location that is believed to be more protected from the impacts of climate change and extreme weather,5 often with intentional policy choices supporting this.6 Cook County was ranked #7 on a list of 10 places that people are migrating to for climate-related reasons.7 However, in addition to recent suspicion towards the term “climate haven,”8 the region has undoubtedly felt the impact of climate change through increasingly extreme temperatures and other new environmental challenges.9 Experts expect that temperatures will continue to rise in the future as the climate crisis continues.10
Precipitation
Precipitation events significantly contribute to Illinois’ weather patterns. These events can range from thunderstorms, floods, droughts, and snowstorms.
Much like climate change has impacted temperature, annual precipitation has increased nationwide and within the region. The chart below shows that recently, Illinois (among other central and northeastern states) has average precipitation rates of up to 10% higher than the national average, with this increasing particularly since 2000.
Figure 4: U.S. Annual Precipitation Compared to 20th-Century Average11

Overall, Illinois is uniquely seeing heavier and more intense rainfall, with a 15% increase from 1895 to 2019, exceeding the national average of 4%.12 However, there is variation within the state, as some regions have experienced a lack of precipitation, resulting in drought. The chart below showcases Illinois’ increasingly wet and warm weather in 2020, showing that southern and northern Illinois have departed from average precipitation patterns. Also, Central Illinois has experienced drier weather.
Figure 5: Precipitation Patterns and Departure in Illinois 202013
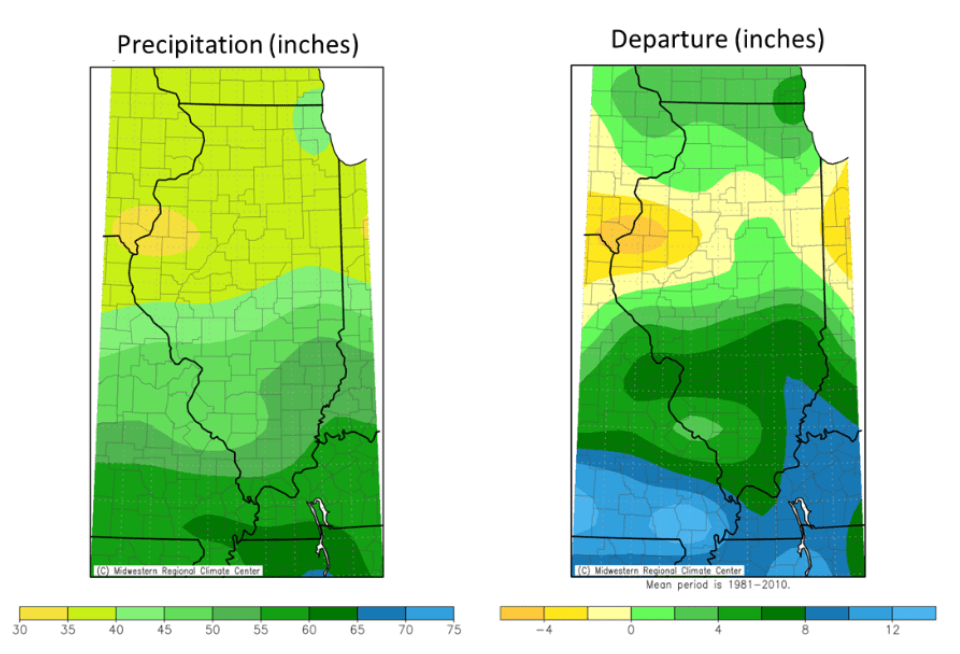
Both trends hold potential for major impact; Increased precipitation means that flooding is more likely, and drought likely impacts Illinois agricultural sector. These impacts will be further discussed in the second section of this fact sheet. Much like extreme heat, these trends are also predicted to increase as climate change worsens.14
Tornadoes
Illinois is no stranger to tornadoes, as it often averages about 50-60 per year.15 However, in recent years, the state has seen more tornadoes; In 2023, Illinois saw more tornadoes than the rest of the United States, totaling 120 tornado events.16 While rates of tornadoes have remained consistent nationwide, meteorologists have noticed an uptick in their frequency in the Midwest, including Illinois.1718 While the chart below doesn’t showcase this change, it illustrates that the central United States and parts of the South are at the highest risk for tornadoes, including Illinois.
Figure 6: National Tornado Risk Index by County19

II: Weather Impact
It’s clear that Illinois is home to its fair share of extreme weather, especially in recent years. But how exactly does this affect those living in Illinois in our day-to-day lives?
Death, injury, and health
Death and injury are unfortunate and often preventable consequences of extreme weather. Across the last 30 years (1995- August 2025), Illinois saw around:20
- 442 heat-related deaths
- 210 extreme cold temperature-related deaths
- 56 flood/heavy rain related deaths
- 53 tornado deaths
- 20 lighting related deaths
- 14 snow and ice storm related deaths
These weather events have brought their fair share of injuries as well. Across the last 30 years (1995- August 2025), Illinois has seen about:
- 1014 injuries from tornados
- 524 injuries from heat
- 407 injuries from thunderstorm
- 80 injuries from lightning
- 68 injuries from winter/ice/snow storms
- 24 injuries from floods
- 2 injuries from cold weather
health
Extreme Weather should be taken as a serious health risk. A few examples of extreme weather’s impact on health include:
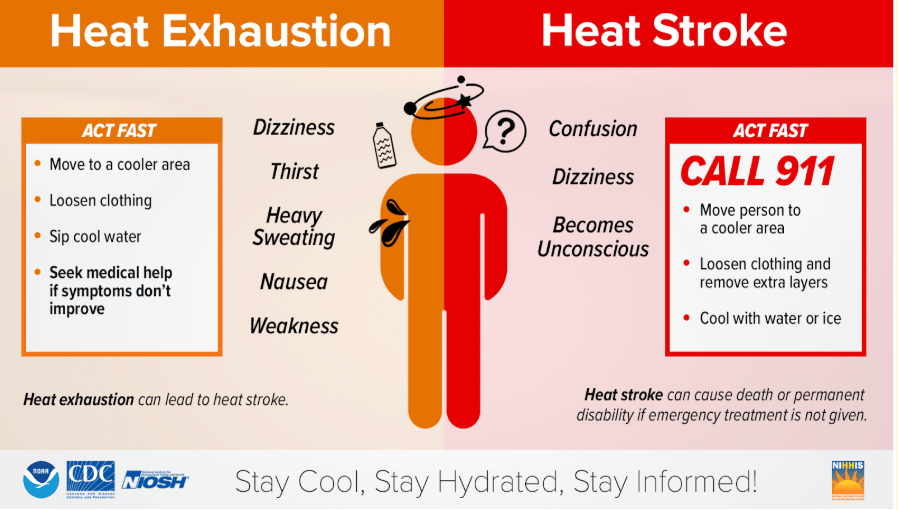
- Heat Illness
- Heat Illness can range from minor conditions like heat exhaustion to more serious conditions like heat stroke. The following chart distinguishes between the two, as heat stroke causes unconsciousness and requires emergent attention.
- Heat Stroke can also lead to serious long-term health impacts like increased risk for heart issues, such as ischaemic heart disease and acute myocardial infarction.21 Preliminary research is also looking into its impact on immune suppression.22
Figure 7: Heat Exhaustion vs Heat Stroke23
- Cold Temperature Illness
- Water-borne Illnesses
- As the chart below describes, when an area floods, it often brings water that can carry dangerous pathogens, hazardous chemicals, and electrical currents. These can cause gastrointestinal illness, skin wounds, and rashes.
Figure 8: Safety Guidelines: Floodwater26

infrastructure/economy
property damage
Property damage is a huge impact of extreme weather in Illinois. Experts estimate that from 2020 to 2024, Illinois saw between $10-20 billion in damages from extreme weather events.27
Recent examples of property damage include
- A flood in Cook County on July 2, 2023, caused 500 million in damage. In addition to the flooding of residential streets and highways (parts of the Eisenhower Expressway and Stevenson Expressway), the Chicago Riverwalk overflowed. Tens of thousands of basements flooded.28
- A tornado in Clay County on May 26, 2024, caused 10 million in damages. It damaged power lines, trees, and a farm.29
- A flash flood in Winnebago County on July 13th and 14th, 2024, caused 2 million dollars in damage. Cars were submerged, drains overflowed, houses flooded, and parking lots were damaged.30
agriculture
As Illinois relies heavily on farming, extreme weather can also interrupt agricultural activity and create consequences for the state economy.
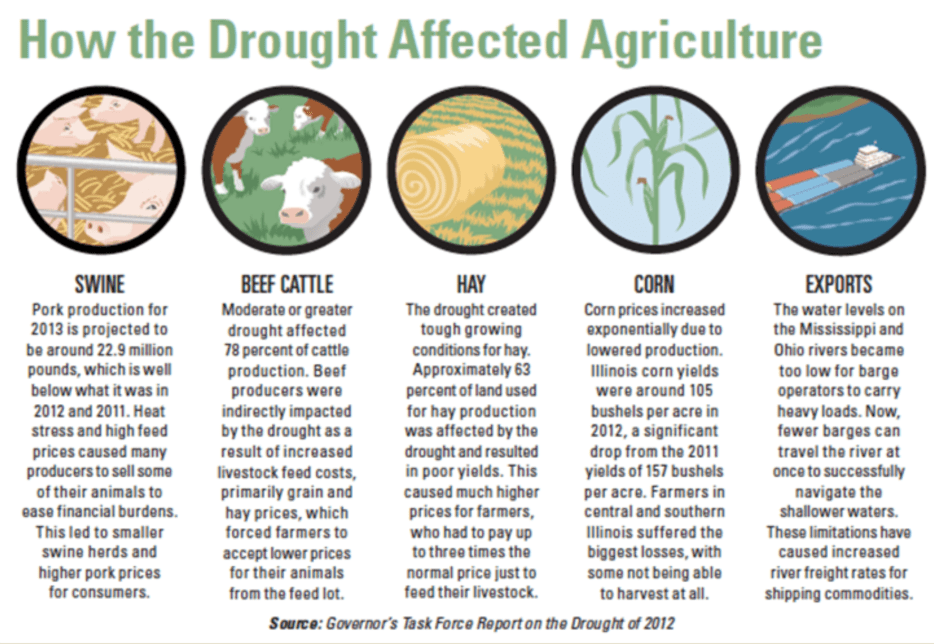
- For example, the 2012 drought that ravaged across the Midwest had devastating impacts for Illinois agriculture, another pillar of extreme weather impacts on Illinois. The diagram below describes some of these, including the disruption in swine, cattle, hay, and corn farming, in addition to general exports.
Figure 9: How the Drought Affected Agriculture31
school closure
- The 2011 Blizzard, “Snowmaggedon,” left 84,00 left without power for two days and led to school closures across Chicago.32
- While all Chicago Public Schools are officially equipped with air conditioning, the Chicago Teachers’ Union has highlighted that, despite this, some classrooms and hallways continue to lack effective temperature control.33
transportation
Transportation is especially vulnerable to extreme weather.
- 64% of CTA bus stops and 47% of Pace bus stops are exposed to flooding. 36% of CTA stations and 31 percent of Metra stations are at risk of flooding. 28% percent of regional trails have high flood risks, and 33 percent have very high flood risk.34 Recently, a CTA bus stop was destroyed due to extreme storms.35
- Storms can often obscure the field of vision while driving. For example, a snowstorm in 2011, nicknamed “Snowmaggedon”, produced heavy winds up to 70 mph, creating near-zero visibility.36
who is most at risk?
While everyone is at risk of extreme weather and its impact, it’s important to consider how certain people might face greater risk than others. Particularly, this section brings attention to sociopolitical factors like wealth inequality, systemic racism, and ableism that intersect with these weather events.
The diagrams below show which populations the National Weather Service considers to be heavily impacted by extreme heat and cold. They highlight pregnant people, newborns, children, the elderly, those with chronic illnesses, outdoor workers, and unhoused people to be most impacted.
Figure 10: Heat Impacts: Vulnerable Populations37
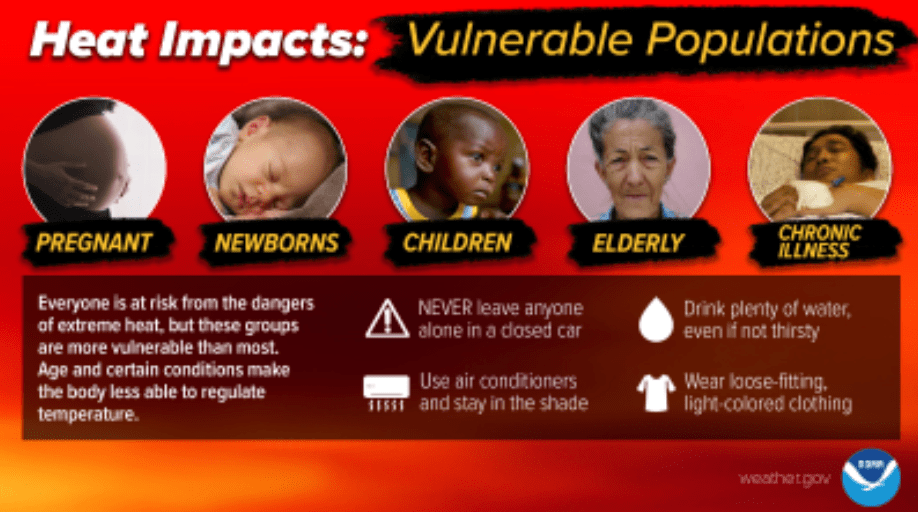
Figure 11: Cold Impacts: Vulnerable Populations38

Many researchers have found that inequality, such as classism39 and racism,40 plays a major role in the difference in risk between communities.4142
Examples of this include:
The Heat Island Effect:
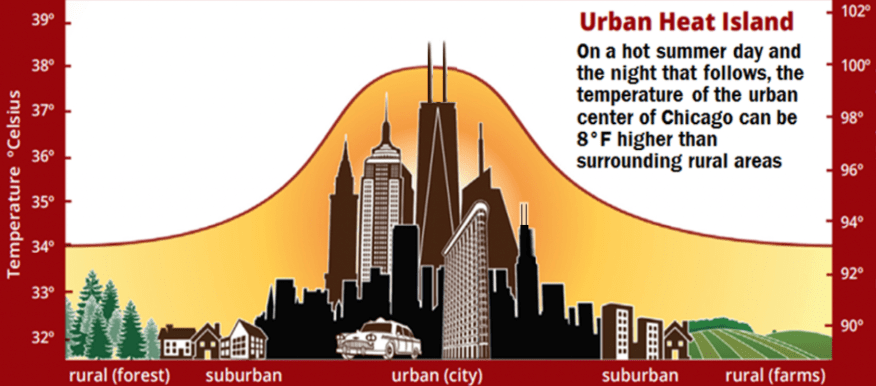
- Chicago is specifically at risk for extreme heat due to the “Heat Island Effect”. As the chart below describes, urban areas often have higher temperatures than suburban and rural areas due to high-density infrastructure, which absorbs and releases more heat than natural landscapes. This can lead to an average increase in daytime temperatures of 1–7°F and nighttime temperatures of 2–5°F compared to other regions.
Figure 12: Urban Heat Islands43
- Heat Islands occur as natural landscapes (trees, vegetation, etc.) are replaced with heat-absorbing urban structures (buildings, pavements, etc).44 So, not only does the heat island effect occur throughout Chicago, but it also has the potential to particularly impact the south and west sides of Chicago. These predominantly black and brown neighborhoods have fewer green spaces as part of larger patterns of segregation and environmental racism.45 Thus, they are at higher risk because of the urban heat island effect.46
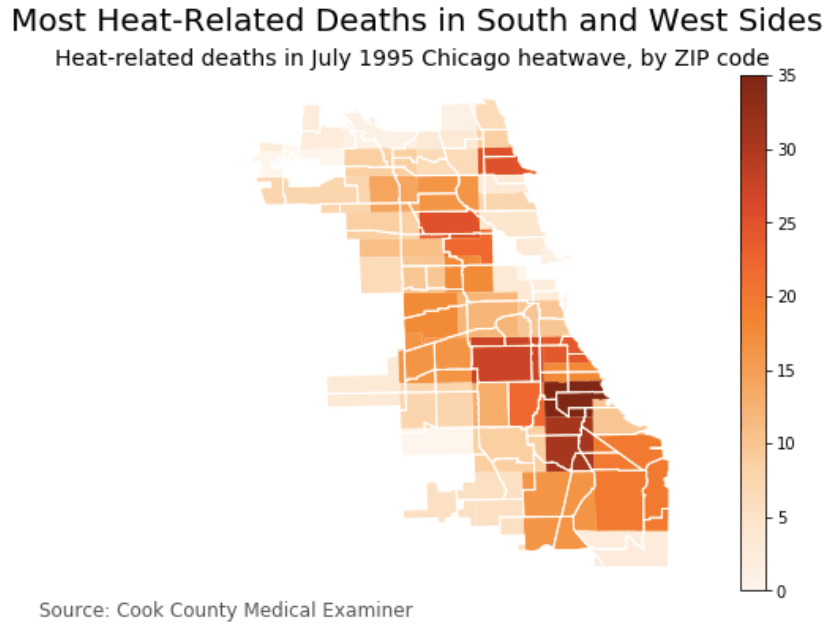
- As the following map shows, South Side neighborhoods like North Lawndale, a predominantly black neighborhood, were disproportionately impacted by the 1995 heatwave. Disproportionate impacts like these are linked to larger patterns of environmental racism and social divestment from the city and private industries.47
Figure 13: Most Heat-Related Deaths in South and West Sides48
Air conditioning
- Those who cannot access air conditioning are more at risk for severe heat illnesses such as heat stroke, as air conditioning can be a determining factor in the health outcomes of extreme heat.49 The Chicagoland area is the thirteenth least air-conditioned city, as 3.9% of households do not have any form of AC.50
- Importantly, air conditioning disparities often impact the most marginalized. For example, 16 of Illinois’ 28 prisons do not have air conditioning.51
Figure 14: Lower-income households are more likely to lack air conditioning52
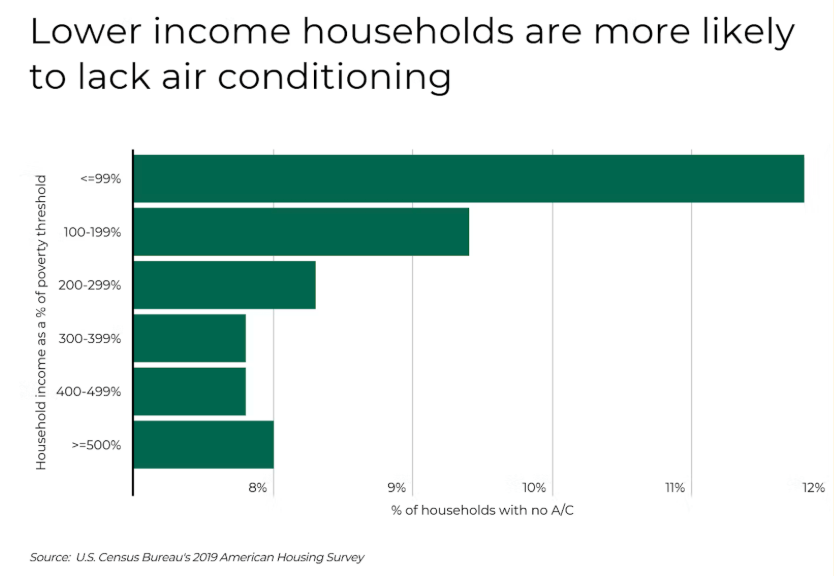
- As the chart above describes, lower-income households are more likely to lack air conditioning, meaning that socioeconomic status plays a role in who might be most impacted by extreme weather like heat waves.
Sewage and Flooding
- When flooding occurs in Chicago, often the sewer systems become overwhelmed and can spew polluted water into homes and streets. This is particularly an issue on the South Side of Chicago.53
Evacuation Centers/Transportation in Crisis
- The inaccessibility of transportation and emergency shelters can put disabled people at higher risk in extreme weather situations.54
- Many prisons and detention centers do not have adequate safety plans, and often refuse to evacuate, posing increased risk to incarcerated folks.55
Resources
Nationwide
- Read.gov
- General information and safety tips about 28 hazard events (from natural disasters to other threats like pandemic, cyberattacks, etc) in Arabic, English, French, Spanish, Creole, Japanese, Korean, Russian, Tagalog, and Simplified Chinese
- CDC Safety Page
- Has forecast information, safety information, and visual guides (with alt text and Spanish translation) for air quality, beach hazards, cold, drought, dust, flood, fog, heat, hurricanes, lightning, rip currents, space weather, thunderstorms, tornado, tsunami, wildfire, wind, and winter.
- CDC Natural Disaster/Extreme Weather Guide
- Compiles various guides for what to do before, during, and after extreme weather to keep you and your community safe. Heat Risk Tracker
- Medications that Interact with Heat
- This page has information on which medications will put you at further risk of overheating and heat illness.
- Find Cooling Centers Near You
- Cooling center information for every state, including numbers and websites.
- Tornado Tracker
- Live map of tornadoes across the US, as well as a written list of storm warnings.
Illinois
- Information on “Home Weatherization” Program for low-income residents
- Information about a public state program that financially sponsors low-income Illinois residents with weather proofing their housing through services like HVAC, water heater repair, insulation, etc.
- Find a Warming Center Near you
- Interactive map of different warming centers across Illinois sorted by county.
- Emergency Preparation Videos in ASL
- ASL videos that cover emergency preparation topics such as making a plan, evacuations, emergency shelters, etc, all created by the Illinois government.
Chicagoland-specific
- Business/School/Institution Closure Map Chicagoland
- Displays a list of schools, businesses, and other institutions with regular updates that are closed due to extreme weather in the Chicagoland area.
- Edith Makra, Priority Climate Action Plan for the Chicago Metropolitan Statistical Area (Metropolitan Mayors Caucus, 2024), https://www.epa.gov/system/files/documents/2024-03/chicago-msa-pcap.pdf. ↩︎
- Ronald H. Brown et al., July 1995 Heat Wave, Natural Disaster Survey Report, with Kathryn D. Sullivan et al. (U.S. Department of Commerce, National Oceanic and Atmospheric Administration, National Weather Service, 1995), https://www.weather.gov/media/publications/assessments/heat95.pdf. ↩︎
- NOAA US Department of Commerce, “Weather Related Fatality and Injury Statistics,” NOAA’s National Weather Service, 2024, https://www.weather.gov/hazstat/. ↩︎
- Where Temperatures Are Rising Fastest, with Climate Impact Lab, The Conversation/CC-BY-ND, August 23, 2023, http://theconversation.com/looking-for-a-us-climate-haven-away-from-disaster-risks-good-luck-finding-one-211990; Julie Arbit US Brad Bottoms, Earl Lewis, The Conversation, “There Are No U.S. ‘Climate Havens’ from Heat and Disaster Risk,” Scientific American, August 25, 2023, https://www.scientificamerican.com/article/there-are-no-u-s-climate-havens-from-heat-and-disaster-risk/. ↩︎
- Causeartist, “19 Top Climate Haven Cities in the United States,” Causeartist, August 2, 2024, https://www.causeartist.com/top-climate-haven-cities-usa/. ↩︎
- Cinnamon Carlarne Hirokawa and Keith H. Hirokawa, “The Climate Haven,” Ohio State Law Journal 85 (2024): 1251. ↩︎
- Corli Jay, “Cook County a Top Destination for Those Escaping Climate Change: Study,” Crain’s Chicago Business, June 6, 2022, https://www.chicagobusiness.com/economy/cook-county-top-destination-those-escaping-climate-change. ↩︎
- Scientific American Editors, “There Is No Such Thing as a Climate Haven,” Scientific American, May 1, 2025, https://www.scientificamerican.com/article/there-is-no-such-thing-as-a-climate-haven/. ↩︎
- Morgan Greene, “Severe Implications of Climate Change in UN Report Extend to Illinois,” Chicago Tribune, February 28, 2022, https://www.chicagotribune.com/2022/02/28/severe-implications-of-climate-change-in-un-report-extend-to-illinois/. ↩︎
- Katharine Hayhoe and Donald Webbles, 2008 Climate Change and Chicago Report (City of Chicago, 2008), 1–22, https://www.chicago.gov/content/dam/city/progs/env/CCAP/Chicago_climate_impacts_report_Executive_Summary.pdf. ↩︎
- Rebecca Lindsey, “Climate Change and the 1991-2020 U.S. Climate Normals,” Climate.Gov – Science & Information for a Climate-Smart Nation, April 19, 2021, https://www.climate.gov/news-features/understanding-climate/climate-change-and-1991-2020-us-climate-normals. ↩︎
- Illinois Department of Natural Resources, “Changing Rainfall Pattern,” Climate Change Impact, 2025, https://dnr.illinois.gov/outreach/climate-action-plan/climate-change-impacts/changing-rainfall-patterns.html ↩︎
- Trent Ford, “2020 Was Warmer and Wetter than Long-Term Average,” January 11, 2021, https://stateclimatologist.web.illinois.edu/2021/01/11/2020-was-warmer-and-wetter-than-long-term-average/. ↩︎
- Illinois Department of Natural Resources, “Changing Rainfall Pattern.” ↩︎
- Illinois State Climatologist, “Tornadoes in Illinois,” Illinois State Climatologist, 2024, https://stateclimatologist.web.illinois.edu/climate-of-illinois/tornadoes-in-illinois/. ↩︎
- Phyllis Cha | WBEZ, “Illinois Saw the Most Tornadoes in the U.S. in 2023, National Weather Service Says,” Chicago Sun-Times, January 17, 2024, https://chicago.suntimes.com/news/2024/1/16/24040771/illinois-most-tornadoes-of-any-state-in-2023-12. ↩︎
- Vittorio A. Gensini and Harold E. Brooks, “Spatial Trends in United States Tornado Frequency,” Npj Climate and Atmospheric Science 1, no. 1 (2018): 38, https://doi.org/10.1038/s41612-018-0048-2. ↩︎
- NOAA US Department of Commerce, “Is Tornado Frequency Increasing in Parts of the U.S.?,” NOAA’s National Weather Service, accessed August 12, 2025, https://www.weather.gov/lmk/niu_tornado_frequency_study. ↩︎
- FEMA, “Tornado | National Risk Index,” FEMA National Risk Index, accessed August 14, 2025, https://hazards.fema.gov/nri/tornado. ↩︎
- National Centers for Enviromental Information, “Storm Events Database,” accessed May 26, 2025, https://www.ncdc.noaa.gov/stormevents/listevents.jsp?eventType=ALL&beginDate_mm=02&beginDate_dd=01&beginDate_yyyy=9999&endDate_mm=02&endDate_dd=28&endDate_yyyy=9999&county=COOK%3A31&hailfilter=0.00&tornfilter=0&windfilter=000&sort=DT&submitbutton=Search&statefips=17%2CILLINOIS. ↩︎
- Min-Feng Tseng et al., “Association between Heat Stroke and Ischemic Heart Disease: A National Longitudinal Cohort Study in Taiwan,” European Journal of Internal Medicine 59 (January 2019): 97–103, https://doi.org/10.1016/j.ejim.2018.09.019. ↩︎
- Kevin O. Murray et al., “Exertional Heat Stroke Leads to Concurrent Long-Term Epigenetic Memory, Immunosuppression and Altered Heat Shock Response in Female Mice,” The Journal of Physiology 599, no. 1 (2021): 119–41, https://doi.org/10.1113/JP280518. ↩︎
- NOAA US Department of Commerce, “Heat Safety and Preparedness,” NOAA’s National Weather Service, accessed August 18, 2025, https://www.weather.gov/lot/heatprepare. ↩︎
- Laura Williamson, “What Cold Weather Does to the Body and How to Protect Yourself This Winter,” American Heart Association, January 3, 2025, https://www.heart.org/en/news/2025/01/03/what-cold-weather-does-to-the-body-and-how-to-protect-yourself-this-winter. ↩︎
- Hennepin Healthcare and Dough Brunette, “Cold Truths about Hypothermia,” Hennepin Healthcare, January 31, 2018, https://www.hennepinhealthcare.org/newsroom/cold-truths-about-hypothermia/. ↩︎
- CDC, “Safety Guidelines: Floodwater,” Floods, September 30, 2024, https://www.cdc.gov/floods/safety/floodwater-after-a-disaster-or-emergency-safety.html. ↩︎
- Adam B. Smith, “U.S. Billion-Dollar Weather and Climate Disasters, 1980 – Present (NCEI Accession 0209268),” NOAA National Centers for Environmental Information, January 10, 2025, https://doi.org/10.25921/STKW-7W73. ↩︎
- National Centers for Environmental Information, “Flash Flood Event Details,” Storm Events Database, July 2, 2023, https://www.ncei.noaa.gov/stormevents/eventdetails.jsp?id=1141644. ↩︎
- National Centers for Environmental Information, “Tornado Event Details,” Storm Events Database, May 26, 2024, https://www.ncei.noaa.gov/stormevents/eventdetails.jsp?id=1183320. ↩︎
- National Centers for Environmental Information, “Flash Flood Event Details,” Storm Events Database, July 13, 2024, https://www.ncei.noaa.gov/stormevents/eventdetails.jsp?id=1184971. ↩︎
- John McBryde, “High and Dry: How the 2012 Drought Affected Illinois Agriculture,” Farm Flavor, July 25, 2013, https://farmflavor.com/illinois/illinois-environment/illinois-drought-2012/. ↩︎
- Linze Rice, “A Look Back At Chicago’s Top 5 Biggest Blizzards,” January 8, 2024, https://blockclubchicago.org/2024/01/08/a-look-back-at-chicagos-top-5-biggest-blizzards-in-history/. ↩︎
- Eric Ruder, “It’s Critical to Stay Safe in the Heat,” Chicago Teachers Union, August 23, 2023, https://www.ctulocal1.org/posts/its-critical-to-stay-safe-in-the-heat/. ↩︎
- Caroline Caruso and Kate Evasic, “New Data Shows Our Transportation System’s Vulnerability to Climate Hazards,” Chicago Metropolitan Agency for Planning, November 22, 2024, https://cmap.illinois.gov/news-updates/new-data-shows-where-northeastern-illinois-transportation-system-is-vulnerable-to-climate-hazards/. ↩︎
- NBC Chicago, “CTA Bus Stop Destroyed by Storm on Chicago’s North Side,” Facebook, July 17, 2025, https://www.facebook.com/watch/?v=1074389064643644. ↩︎
- Rice, “A Look Back At Chicago’s Top 5 Biggest Blizzards.” ↩︎
- NOAA US Department of Commerce, “Vulnerable Populations (Actions),” Social Media: Heat Safety, NOAA’s National Weather Service, accessed August 25, 2025, https://www.weather.gov/wrn/heat-sm#sp13. ↩︎
- NOAA US Department of Commerce, “Cold Impacts: Vulnerable Populations,” Social Media: Cold and Winter Hazards, NOAA’s National Weather Service, accessed August 25, 2025, https://www.weather.gov/wrn/winter-sm#sp24. ↩︎
- Susanne Amelie Benz and Jennifer Anne Burney, “Widespread Race and Class Disparities in Surface Urban Heat Extremes Across the United States,” Earth’s Future 9, no. 7 (2021): e2021EF002016, https://doi.org/10.1029/2021EF002016. ↩︎
- Shijuan Chen et al., “More Extremely Hot Days, More Heat Exposure and Fewer Cooling Options for People of Color in Connecticut, U.S.,” Npj Urban Sustainability 4, no. 1 (2024): 47, https://doi.org/10.1038/s42949-024-00186-5. ↩︎
- Aliya Al-Sadi, “Heat Action Day 2025: Recognizing Heat Exhaustion and Heat Stroke,” June 2, 2025, https://www.naccho.org/blog/articles/heat-action-day-2025#:~:text=June%202%20marks%20Heat%20Action,can%20take%20to%20stay%20safe. ↩︎
- Jillian Mckoy, Extreme Heat May Substantially Raise Mortality Risk for People Experiencing Homelessness, October 11, 2024, https://www.bu.edu/sph/news/articles/2024/extreme-heat-may-substantially-raise-mortality-risk-for-people-experiencing-homelessness/. ↩︎
- NOAA US Department of Commerce, “Urban Heat Islands,” Heat Safety and Preparedness, NOAA’s National Weather Service, accessed August 18, 2025, https://www.weather.gov/lot/heatprepare. ↩︎
- Marlee Bird, The Temperature of Disinvestment: Examining Urban Heat Islands and Historically Redlined Communities » NCRC, Field Notes, July 7, 2022, https://ncrc.org/the-temperature-of-disinvestment-examining-urban-heat-islands-and-historically-redlined-communities/. ↩︎
- Alden Loury, “While Things Have Improved, Chicago Remains the Most Segregated City in America,” WBEZ, June 19, 2023, https://www.wbez.org/race-class-communities/2023/06/19/chicago-remains-the-most-segregated-big-city-in-america. ↩︎
- Melba Newsome, “Discrimination Has Trapped People of Color in Unhealthy Urban ‘Heat Islands,’” Nature 621, no. 7979 (2023): S48–49, https://doi.org/10.1038/d41586-023-02618-1. ↩︎
- Eric Klinenberg, Heat Wave: A Social Autopsy of Disaster in Chicago, ed. With a New Preface (University of Chicago Press, 2015), https://press.uchicago.edu/ucp/books/book/chicago/H/bo20809880.html. ↩︎
- Charmaine Runes and Elora Apantaku, “A City of Extremes: How the 1995 Heat Wave and COVID-19 Reveal What’s Changed (and What Hasn’t) in Chicago’s Health Equity Landscape,” South Side Weekly, July 22, 2020, https://southsideweekly.com/city-extremes-1995-heat-wave-covid-19-reveal-whats-changed-hasnt-chicagos-health-equity-landscape/. ↩︎
- Alejandra Flores et al., “Without Air Conditioning, Chicagoans Are Unknowingly Exposed to Fatal Levels of Heat Inside Their Homes,” Illinois Tech, August 14, 2024, https://www.iit.edu/news/without-air-conditioning-chicagoans-are-unknowingly-exposed-fatal-levels-heat-inside-their-homes. ↩︎
- US Census Bureau, “American Housing Survey (AHS),” Census.Gov, 2019, https://www.census.gov/programs-surveys/ahs.html. ↩︎
- Michelle Eccles, “A Prison Watchdog Group Is Warning about Summer Temperatures in Illinois Prisons,” NPR Illinois, June 16, 2025, https://www.nprillinois.org/news/2025-06-16/a-prison-watchdog-group-is-warning-about-summer-temperatures-in-illinois-prisons-first-listen. ↩︎
- Bureau, “American Housing Survey (AHS).” ↩︎
- Dan Egan, “A Battle Between a Great City and a Great Lake,” Climate, The New York Times, July 8, 2021, https://www.nytimes.com/interactive/2021/07/07/climate/chicago-river-lake-michigan.html. ↩︎
- Rachel Reed, “Disability in a Time of Climate Disaster,” with Michael Ashley Stein, Harvard University Center for the Environment, January 19, 2023, https://www.environment.harvard.edu/news/disability-time-climate-disaster. ↩︎
- N’dea Yancey-Bragg, “Hurricane Ian Brings Renewed Focus to ‘life and Death’ Struggle for Prisoners during a Disaster,” USA TODAY, accessed July 19, 2025, https://www.usatoday.com/story/news/nation/2022/10/14/hurricane-ian-jails-prisons-florida/8189762001/. ↩︎
Bibliography
Al-Sadi, Aliya. “Heat Action Day 2025: Recognizing Heat Exhaustion and Heat Stroke.” June 2, 2025. https://www.naccho.org/blog/articles/heat-action-day-2025#:~:text=June%202%20marks%20Heat%20Action,can%20take%20to%20stay%20safe.
Benz, Susanne Amelie, and Jennifer Anne Burney. “Widespread Race and Class Disparities in Surface Urban Heat Extremes Across the United States.” Earth’s Future 9, no. 7 (2021): e2021EF002016. https://doi.org/10.1029/2021EF002016.
Bird, Marlee. The Temperature of Disinvestment: Examining Urban Heat Islands and Historically Redlined Communities » NCRC. Field Notes. July 7, 2022. https://ncrc.org/the-temperature-of-disinvestment-examining-urban-heat-islands-and-historically-redlined-communities/.
Brown, Ronald H., D. James Baker, and Elbert W. Friday Jr. July 1995 Heat Wave. Natural Disaster Survey Report. With Kathryn D. Sullivan, Eugene P. Auciello, Christopher R. Adams, et al. U.S. Department of Commerce, National Oceanic and Atmospheric Administration, National Weather Service, 1995. https://www.weather.gov/media/publications/assessments/heat95.pdf.
Bureau, US Census. “American Housing Survey (AHS).” Census.Gov, 2019. https://www.census.gov/programs-surveys/ahs.html.
Caruso, Caroline, and Kate Evasic. “New Data Shows Our Transportation System’s Vulnerability to Climate Hazards.” Chicago Metropolitan Agency for Planning, November 22, 2024. https://cmap.illinois.gov/news-updates/new-data-shows-where-northeastern-illinois-transportation-system-is-vulnerable-to-climate-hazards/.
Causeartist. “19 Top Climate Haven Cities in the United States.” Causeartist, August 2, 2024. https://www.causeartist.com/top-climate-haven-cities-usa/.
CDC. “Safety Guidelines: Floodwater.” Floods, September 30, 2024. https://www.cdc.gov/floods/safety/floodwater-after-a-disaster-or-emergency-safety.html.
Chen, Shijuan, Katie Lund, Colleen Murphy-Dunning, and Karen C. Seto. “More Extremely Hot Days, More Heat Exposure and Fewer Cooling Options for People of Color in Connecticut, U.S.” Npj Urban Sustainability 4, no. 1 (2024): 47. https://doi.org/10.1038/s42949-024-00186-5.
Corli Jay. “Cook County a Top Destination for Those Escaping Climate Change: Study.” Crain’s Chicago Business, June 6, 2022. https://www.chicagobusiness.com/economy/cook-county-top-destination-those-escaping-climate-change.
Eccles, Michelle. “A Prison Watchdog Group Is Warning about Summer Temperatures in Illinois Prisons.” NPR Illinois, June 16, 2025. https://www.nprillinois.org/news/2025-06-16/a-prison-watchdog-group-is-warning-about-summer-temperatures-in-illinois-prisons-first-listen.
Egan, Dan. “A Battle Between a Great City and a Great Lake.” Climate. The New York Times, July 8, 2021. https://www.nytimes.com/interactive/2021/07/07/climate/chicago-river-lake-michigan.html.
FEMA. “Tornado | National Risk Index.” FEMA National Risk Index. Accessed August 14, 2025. https://hazards.fema.gov/nri/tornado.
Flores, Alejandra, Kayleigh Padar, and Kevin Dollear. “Without Air Conditioning, Chicagoans Are Unknowingly Exposed to Fatal Levels of Heat Inside Their Homes.” Illinois Tech, August 14, 2024. https://www.iit.edu/news/without-air-conditioning-chicagoans-are-unknowingly-exposed-fatal-levels-heat-inside-their-homes.
Gensini, Vittorio A., and Harold E. Brooks. “Spatial Trends in United States Tornado Frequency.” Npj Climate and Atmospheric Science 1, no. 1 (2018): 38. https://doi.org/10.1038/s41612-018-0048-2.
Greene, Morgan. “Severe Implications of Climate Change in UN Report Extend to Illinois.” Chicago Tribune, February 28, 2022. https://www.chicagotribune.com/2022/02/28/severe-implications-of-climate-change-in-un-report-extend-to-illinois/.
Hayhoe, Katharine, and Donald Webbles. 2008 Climate Change and Chicago Report. City of Chicago, 2008. https://www.chicago.gov/content/dam/city/progs/env/CCAP/Chicago_climate_impacts_report_Executive_Summary.pdf.
Hennepin Healthcare, and Dough Brunette. “Cold Truths about Hypothermia.” Hennepin Healthcare, January 31, 2018. https://www.hennepinhealthcare.org/newsroom/cold-truths-about-hypothermia/.
Hirokawa, Cinnamon Carlarne, and Keith H. Hirokawa. “The Climate Haven.” Ohio State Law Journal 85 (2024): 1251.
Illinois Department of Natural Resources. “Changing Rainfall Pattern.” Climate Change Impact, 2025. https://dnr.illinois.gov/outreach/climate-action-plan/climate-change-impacts/changing-rainfall-patterns.html.
Illinois State Climatologist. “Tornadoes in Illinois.” Illinois State Climatologist, 2024. https://stateclimatologist.web.illinois.edu/climate-of-illinois/tornadoes-in-illinois/.
Lindsey, Rebecca. “Climate Change and the 1991-2020 U.S. Climate Normals.” Climate.Gov – Science & Information for a Climate-Smart Nation, April 19, 2021. https://www.climate.gov/news-features/understanding-climate/climate-change-and-1991-2020-us-climate-normals.
Loury, Alden. “While Things Have Improved, Chicago Remains the Most Segregated City in America.” WBEZ, June 19, 2023. https://www.wbez.org/race-class-communities/2023/06/19/chicago-remains-the-most-segregated-big-city-in-america.
Makra, Edith. Priority Climate Action Plan for the Chicago Metropolitan Statistical Area. Metropolitan Mayors Caucus, 2024. https://www.epa.gov/system/files/documents/2024-03/chicago-msa-pcap.pdf.
McBryde, John. “High and Dry: How the 2012 Drought Affected Illinois Agriculture.” Farm Flavor, July 25, 2013. https://farmflavor.com/illinois/illinois-environment/illinois-drought-2012/.
Mckoy, Jillian. Extreme Heat May Substantially Raise Mortality Risk for People Experiencing Homelessness. October 11, 2024. https://www.bu.edu/sph/news/articles/2024/extreme-heat-may-substantially-raise-mortality-risk-for-people-experiencing-homelessness/.
Murray, Kevin O., Jason O. Brant, John D. Iwaniec, et al. “Exertional Heat Stroke Leads to Concurrent Long-Term Epigenetic Memory, Immunosuppression and Altered Heat Shock Response in Female Mice.” The Journal of Physiology 599, no. 1 (2021): 119–41. https://doi.org/10.1113/JP280518.
National Centers for Environmental Information. “Flash Flood Event Details.” Storm Events Database, July 2, 2023. https://www.ncei.noaa.gov/stormevents/eventdetails.jsp?id=1141644.
National Centers for Environmental Information. “Flash Flood Event Details.” Storm Events Database, July 13, 2024. https://www.ncei.noaa.gov/stormevents/eventdetails.jsp?id=1184971.
National Centers for Environmental Information. “Tornado Event Details.” Storm Events Database, May 26, 2024. https://www.ncei.noaa.gov/stormevents/eventdetails.jsp?id=1183320.
NBC Chicago. “CTA Bus Stop Destroyed by Storm on Chicago’s North Side.” Facebook, July 17, 2025. https://www.facebook.com/watch/?v=1074389064643644.
Newsome, Melba. “Discrimination Has Trapped People of Color in Unhealthy Urban ‘Heat Islands.’” Nature 621, no. 7979 (2023): S48–49. https://doi.org/10.1038/d41586-023-02618-1.
Reed, Rachel. “Disability in a Time of Climate Disaster.” With Michael Ashley Stein. Harvard University Center for the Environment, January 19, 2023. https://www.environment.harvard.edu/news/disability-time-climate-disaster.
Rice, Linze. “A Look Back At Chicago’s Top 5 Biggest Blizzards.” January 8, 2024. https://blockclubchicago.org/2024/01/08/a-look-back-at-chicagos-top-5-biggest-blizzards-in-history/.
Ruder, Eric. “It’s Critical to Stay Safe in the Heat.” Chicago Teachers Union, August 23, 2023. https://www.ctulocal1.org/posts/its-critical-to-stay-safe-in-the-heat/.
Runes, Charmaine and Elora Apantaku,. “A City of Extremes: How the 1995 Heat Wave and COVID-19 Reveal What’s Changed (and What Hasn’t) in Chicago’s Health Equity Landscape.” South Side Weekly, July 22, 2020. https://southsideweekly.com/city-extremes-1995-heat-wave-covid-19-reveal-whats-changed-hasnt-chicagos-health-equity-landscape/.
Scientific American Editors. “There Is No Such Thing as a Climate Haven.” Scientific American, May 1, 2025. https://www.scientificamerican.com/article/there-is-no-such-thing-as-a-climate-haven/.
Smith, Adam B. “U.S. Billion-Dollar Weather and Climate Disasters, 1980 – Present (NCEI Accession 0209268).” NOAA National Centers for Environmental Information, January 10, 2025. https://doi.org/10.25921/STKW-7W73.
Trent Ford. “2020 Was Warmer and Wetter than Long-Term Average.” January 11, 2021. https://stateclimatologist.web.illinois.edu/2021/01/11/2020-was-warmer-and-wetter-than-long-term-average/.
Tseng, Min-Feng, Chu-Lin Chou, Chi-Hsiang Chung, et al. “Association between Heat Stroke and Ischemic Heart Disease: A National Longitudinal Cohort Study in Taiwan.” European Journal of Internal Medicine 59 (January 2019): 97–103. https://doi.org/10.1016/j.ejim.2018.09.019.
US Department of Commerce, NOAA. “Cold Impacts: Vulnerable Populations.” Social Media: Cold and Winter Hazards, NOAA’s National Weather Service. Accessed August 25, 2025. https://www.weather.gov/wrn/winter-sm#sp24.
US Department of Commerce, NOAA. “Urban Heat Islands.” Heat Safety and Preparedness, NOAA’s National Weather Service. Accessed August 18, 2025. https://www.weather.gov/lot/heatprepare.
US Department of Commerce, NOAA. “Vulnerable Populations (Actions).” Social Media: Heat Safety, NOAA’s National Weather Service. Accessed August 25, 2025. https://www.weather.gov/wrn/heat-sm#sp13.
US Department of Commerce, NOAA. “Weather Related Fatality and Injury Statistics.” NOAA’s National Weather Service, 2024. https://www.weather.gov/hazstat/.
US, Julie Arbit, Brad Bottoms, Earl Lewis, The Conversation. “There Are No U.S. ‘Climate Havens’ from Heat and Disaster Risk.” Scientific American, August 25, 2023. https://www.scientificamerican.com/article/there-are-no-u-s-climate-havens-from-heat-and-disaster-risk/.
WBEZ, Phyllis Cha |. “Illinois Saw the Most Tornadoes in the U.S. in 2023, National Weather Service Says.” Chicago Sun-Times, January 17, 2024. https://chicago.suntimes.com/news/2024/1/16/24040771/illinois-most-tornadoes-of-any-state-in-2023-120.
Where Temperatures Are Rising Fastest. With Climate Impact Lab. The Conversation/CC-BY-ND, August 23, 2023. http://theconversation.com/looking-for-a-us-climate-haven-away-from-disaster-risks-good-luck-finding-one-211990.
Williamson, Laura. “What Cold Weather Does to the Body and How to Protect Yourself This Winter.” American Heart Association, January 3, 2025. https://www.heart.org/en/news/2025/01/03/what-cold-weather-does-to-the-body-and-how-to-protect-yourself-this-winter.Yancey-Bragg, N’dea. “Hurricane Ian Brings Renewed Focus to ‘Life and Death’ Struggle for Prisoners during a Disaster.” USA TODAY. Accessed July 19, 2025. https://www.usatoday.com/story/news/nation/2022/10/14/hurricane-ian-jails-prisons-florida/8189762001/.

Leave a comment