Access summary:
- The Disaster Ableism Blog Series shares stories about how disabled people get through disasters.
- The project gives easy-to-use information and explains research in simple ways.
- It argues that disabled people’s deaths and injuries caused by disasters should never be seen as normal. Governments need to take action.
- The blog uplifts the knowledge and strength of disability communities people so everyone can stay safe and do well during the climate crisis.
- This first post shows how extreme weather—heat waves, floods, droughts, hurricanes, and wildfires—is getting worse by using facts from climate science.
How’s the weather in your area today?
What is the latest disaster you saw on TV or heard on radio?
How does extreme weather impact your body and mind—does it give you more aches, anxiety, or an adrenaline rush as survival mode kicks in?
What would give you a sense of safety and security in this world where the climate crisis has become the norm?
Welcome to the Disaster Ableism Blog Series!
This is part of We Survive Together, a project using storytelling and research to make sure disabled people in general and particularly those coming from multiple marginalized communities survive disaster ableism of all sizes.
Here, a blog is used to understand current conversations on disasters critically and by centering the needs and wisdom of disability communities.There is also a sibling blog series, Disaster Testimonials. Different disabled people in Chicago (and eventually Illinois and the larger Midwest) will be sharing their stories of disaster ableism and their survival tips.
Disaster Ableism Blog Series
- offers helpful resources for disabled people to survive and thrive together in this world where disasters are more frequent and intensified,
- translates disaster and disability research into more easily graspable writings,
- pursues disaster and disability justice, (what are they? Look for future blogs!)
- works to convince the general society that higher casualties of disabled people at the time of disasters are NOT inevitable, and
- aims to mobilize people to hold governments accountable and push back against the notion that disaster preparedness is an individual responsibility.
This first post is written by Akemi Nishida, the main facilitator of this website. I use activism, research, and education to contribute to disability justice activism. This means I am committed to approaching the world critically while nurturing disability communities with an abundance of love and care, including the disabled ecosystem. I also teach disability studies and gender and women’s studies at the University of Illinois Chicago.
I write this series of blogs to share what I learn from disability, disaster, and environmental justice activists and artists with the help of disability justice activists, artists, and students in the Chicagoland area.
I am a disabled Asian immigrant cis-woman who strives to be a better ally to trans communities. I am originally from Japan which means I grew up experiencing an array of disasters (including typhoons, earthquakes, floods, volcanic eruptions, extreme heat, and bad quality air) and am responsible for my nation’s (settler) colonial violence historically and currently. Being Japanese also means that I grew up in a culture which taught me that each nature has its own deity, and we must respect them.
I write this blog from the unceded land of the Three Fires Confederacy, Bodéwadmi, Ojibwe, and Odawa. The land is also known as Chicago, and other tribes such as the Miami, Ho-Chunk, Menominee, and Sac and Fox have deep connections to the land and water too. I work to reflect what it means to write blogs while living with such realities of Chicago, in addition to those of Japan.
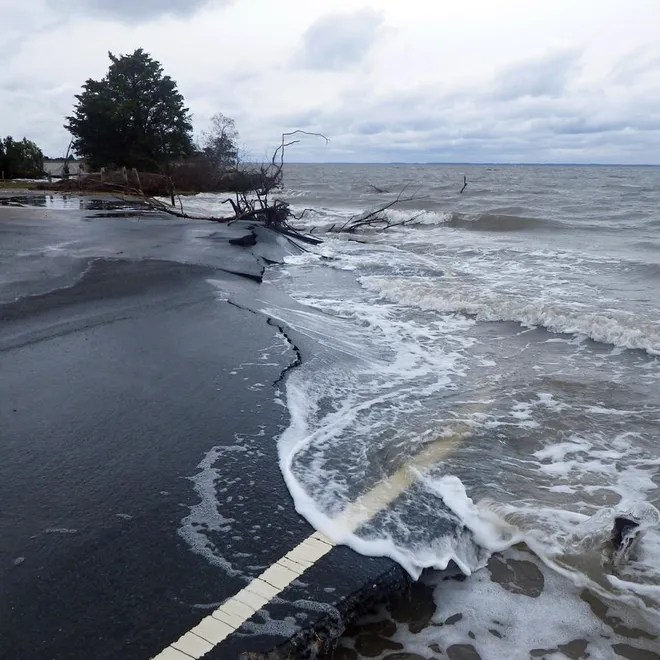
I wrap up this blog by unfolding the fact: disasters and extreme weather events continue to be more frequent, intense, and extensive.
Many people may be thinking that it is an obvious truth! Many others, I am sure, want to learn more about it or are even skeptical about it. Here is some information.
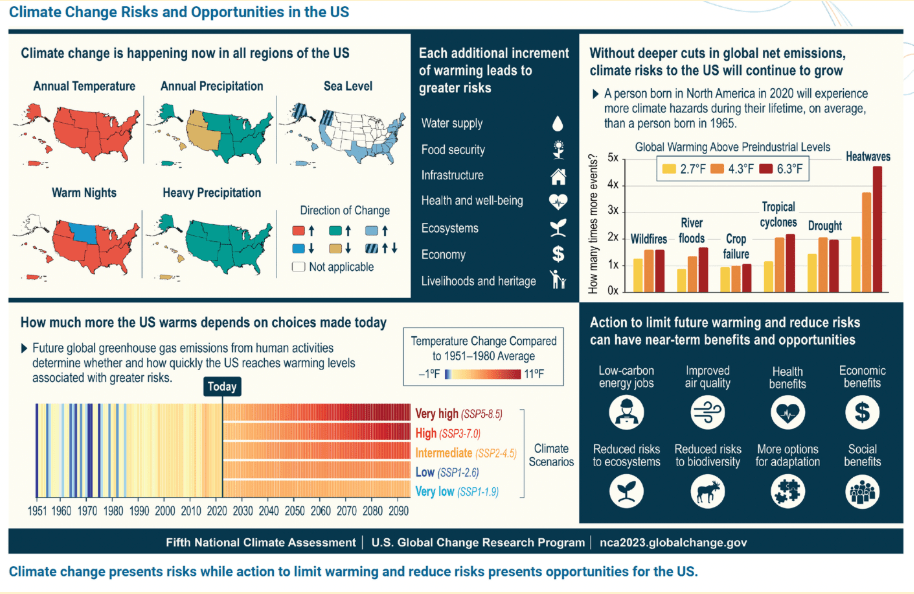
“One of the most direct ways that Americans experience climate change is through increases in the frequency and intensity of extreme weather events”—White House, 2023.2
This is a statement by the Biden administration as it summarizes the Fifth National Climate Assessment. The Assessment is a major report to inform people how climate change impacts the natural environment, biodiversity, our well-being, the nation’s economies, and energy resources. Although the Assessment has been taken down by the current Trump administration, it rings an alarm on how the welfare of nature and humans is deteriorating dramatically on this warming planet. The following charts and infographics are from the Assessment describing changing temperature, precipitation, sea level, and what impacts such changes bring to our daily lives; potential climate risks based on how we (not) adjust our greenhouse emissions; and what we can do to reduce the risks. These data are further unfolded below and the image description of the chart is available below the image.
Image: 5th National Climate Assessment Overview 1-6
Hotter!
A number of scientific reports assert the temperature is rising. 2024 was the world’s hottest year since the global temperature record began in 1850, and the ten hottest years have happened in the last decade (as of 2024).3 Across the US, we experience double the number of heatwaves today (from a little over three heat waves to a little over six heat waves a year), longer duration of heat waves, and a 30-day increase in heat wave season (from 40 to 70 days) compared to the 80s.4 When your grandparents say, “People nowadays are weak! We never needed air conditioners growing up!”, people are not weaker today, but children born today will experience at least two to four times more heatwaves in their lifetimes than their grandparents did in their lifetimes. AC is, indeed, becoming a necessity in many areas of the US to keep us safe, as heat continues to be the leading weather-related cause of death.5 It is so, even though the use of AC contributes to the further warming of the Earth. The Center for Disease Control and Prevention reports that an average of about 700 deaths and 9,200 hospitalizations happen each year due to extreme heat. That’s higher than flooding, hurricanes, tornadoes, cold weather, and lightning.6
Rainier!
Higher temperature means more water evaporates from the land and oceans which causes an increase in rainfall in some areas and droughts in others. More and more Americans are experiencing an increase in rain, particularly east of the Rocky Mountains. Severe rains have become more frequent across the nation, with record-high amounts of rain hitting us in a single day.7 This increases the chance of (flash) flooding generally and in areas where flooding was never an issue. 2025 is said to be the year of the flood, as National Weather Service offices issued more flood warnings than they did in the past (as of Aug of 2025).8 Some report shows that precipitation in the contiguous 48 states has increased at a rate of 0.18 inches per decade.9
Drier!
Simultaneously, droughts become more common, particularly in the Southwest region. Since the beginning of the 21st century, the region has experienced its driest period in the past 1,200 years. In addition, trends show that droughts continue for a longer time compared to the past.10
More Intense Hurricanes and Tornadoes!
Hurricanes have intensified, dropping more rain with heightened storm surges. This leaves less time for people to evacuate or prepare for it. For tornadoes as well, there are more occurrences of “tornado outbreaks” where multiple tornadoes happen at the same time in the same region. Their intensities got more severe, and the tornado season is extending into fall.11
More Fire and Smoke!
Much of the US experiences more intense and frequent wildfires today due to the warming temperature, drier air, and suppression of Native people’s fire stewardship. Global warming (which is attributed to human activities) causes an almost 70% increase in dryness in the West, compared to the early 80s. Wildfires have been impacting the West for the past few decades, while smoke from wildfires reaches wider areas.12
Conclusion
Unprecedented disasters in their numbers and intensities are the norm today. It changes our lives dramatically. Not only our day-to-day lives, but the nation’s economy is deeply scarred as well. And many are forced to relocate, since their locales become uninhabitable. While we often hear or read how disasters do not discriminate, disaster mitigation, preparedness, response, and recovery programs do. Not everyone is impacted by disasters equally. Disability communities, certainly, are hit by them differently than their nondisabled counterparts. This also means disability communities have deep knowledge on how to survive it collectively too.
In future blogs, I will uplift such knowledge for our collective survival. We are surviving and will survive and thrive together!
Related: Check out Natural Disasters and Extreme Weather in Illinois: A Factsheet by Chamberland under the “Research” section of the website for more Illinois-specific data.
- World Wildlife Fund. (n.d.). Is climate change increasing the risk of disasters? Facts about floods, fires, hurricanes, and tornadoes. https://www.worldwildlife.org/resources/explainers/is-climate-change-increasing-the-risk-of-disasters/#:~:text=lot%20of%20water.-,Tornadoes,can%20implement%20stronger%20building%20codes. ↩︎
- White House. (November 9, 2023). FACT SHEET: Fifth national climate assessment details impacts of climate change on regions across the United States. https://bidenwhitehouse.archives.gov/ostp/news-updates/2023/11/09/fact-sheet-fifth-national-climate-assessment-details-impacts-of-climate-change-on-regions-across-the-united-states/ ↩︎
- Lindsay, R., & Dahlman, L. (May 29, 2025). Climate Change: Global temperature. National Oceanic and Atmospheric Administration. https://www.climate.gov/news-features/understanding-climate/climate-change-global-temperature ↩︎
- United States Environmental Protection Agency. (August 22, 2025). Climate change indicators: Heat waves. https://www.epa.gov/climate-indicators/climate-change-indicators-heat-waves ↩︎
- Office of Community Services. (2022). LIHEAP and extreme heat. https://liheap-and-extreme-heat-hhs-acf.hub.arcgis.com/ ↩︎
- Office of Community Services. (2022). LIHEAP and extreme heat. https://liheap-and-extreme-heat-hhs-acf.hub.arcgis.com/ ↩︎
- United States Environmental Protection Agency. (August 11, 2025). Climate change indicators: Heavy precipitation. https://www.epa.gov/climate-indicators/climate-change-indicators-heavy-precipitation ↩︎
- Rice, D. (July 15, 2025). 2025 had become ‘the year of the flood.’ Why is it raining so much? USA TODAY. https://www.aol.com/2025-become-flood-heres-why-181138784.html#:~:text=%222025%20has%20been%20the%20year,East%20Coast%20states%20this%20month. ↩︎
- United States Environmental Protection Agency. (May 9, 2025). Climate change indicators: U.S. and global precipitation. https://www.epa.gov/climate-indicators/climate-change-indicators-us-and-global-precipitation ↩︎
- U.S. Global Change Research Program. (2023). Fifth National Climate Assessment. https://doi.org/10.7930/NCA5.2023 ↩︎
- U.S. Global Change Research Program. (2023). Fifth National Climate Assessment. https://doi.org/10.7930/NCA5.2023 ↩︎
- U.S. Global Change Research Program. (2023). Fifth National Climate Assessment. https://doi.org/10.7930/NCA5.2023 ↩︎

Leave a reply to Higher casualties among disabled people are NOT inevitable (Part 1): How disaster scholars understand “disaster” – We Survive Together Cancel reply